Hello all,
I hope this is the right place to make such an announcement.
As you can see in the title I started with the creation of a small library for drawing charts with the help of haxeui, named hxchart.
I had the idea for some time now, but never really got the courage/time to work on it. But now I finally gave myself a push and created something. As it is only version 0.0.1 it is still in early development and prone to a lot of changes.
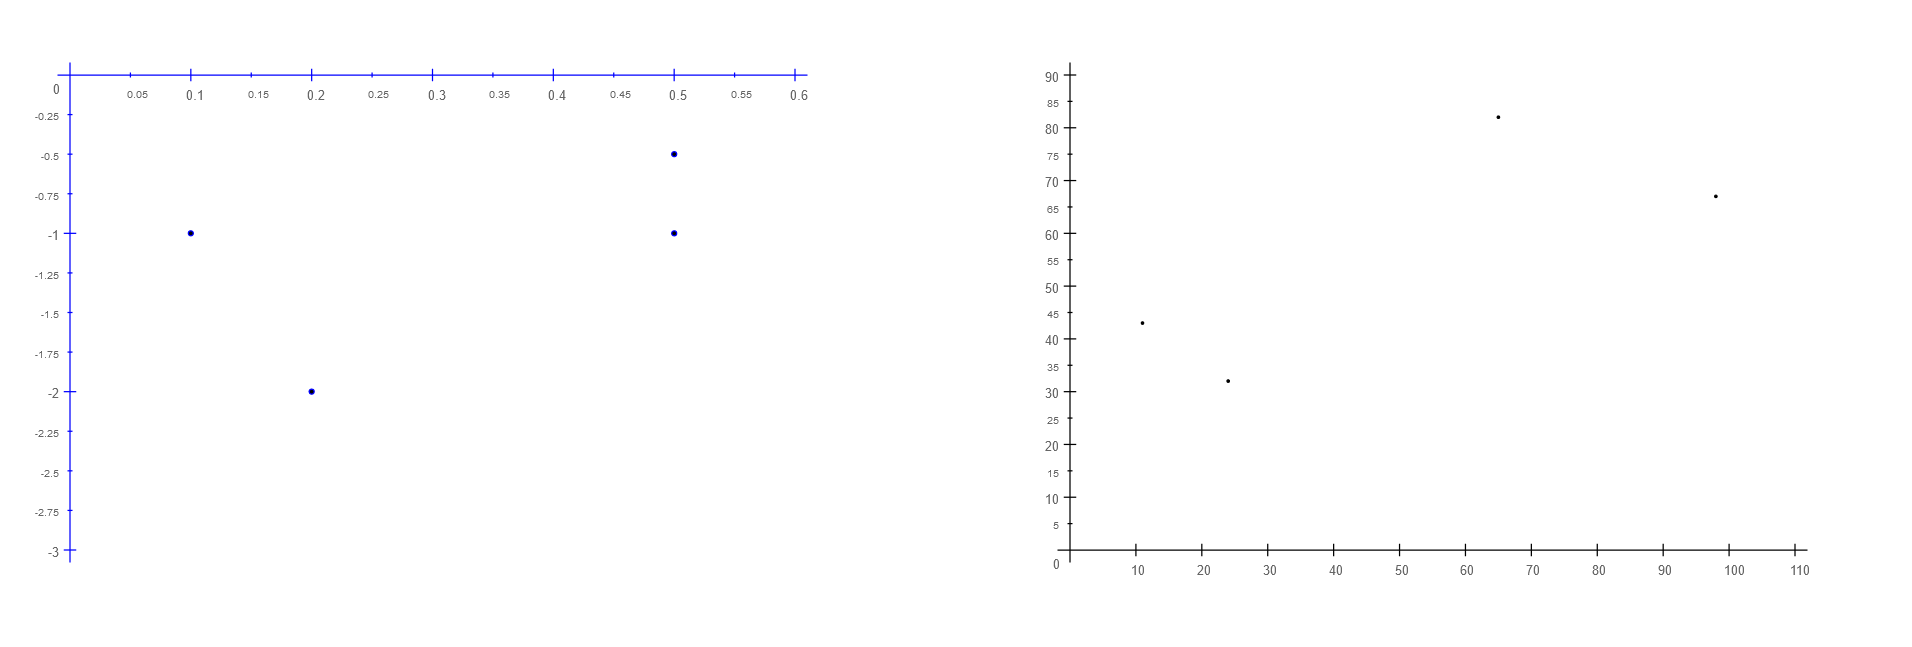
But for now you can create small Point-Charts, that should be responsive (I hope ![]() ).
).
var chart = new Chart();
chart.setPoints([1,2], [1,2]);
...
// Add the component via
app.addComponent(chart.draw());
Thank you for your time (and thanks to Ian for creating haxeui),
Sincerely Leon Veith (TaarSirion on Github)
P.S.: here is the link to the repo: https://github.com/TaarSirion/hxchart